Citation
D. Bhattacharya, J. Zhong, S. Tavakoli, A. Kabla and P. Matsudaira
Scientific Reports volume 11:19357 (2021)
Abstract
Abstract
During gastrulation of the zebrafish embryo, the cap of blastoderm cells organizes into the axial body plan of the embryo with left–right symmetry and head–tail, dorsal–ventral polarities. Our labs have been interested in the mechanics of early development and have investigated whether these large-scale cell movements can be described as tissue-level mechanical strain by a tectonics-based approach. The first step is to image the positions of all nuclei from mid-epiboly to early segmentation by digital sheet light microscopy, organize the surface of the embryo into multi-cell spherical domains, construct velocity fields from the movements of these domains and extract strain rate maps from the change in density of the domains. During gastrulation, tensile/expansive and compressive strains in the axial and equatorial directions are detected as anterior and posterior expansion along the anterior–posterior axis and medial–lateral compression across the dorsal–ventral axis and corresponds to the well characterized morphological movements of convergence and extension. Following gastrulation strain is represented by localized medial expansion at the onset of segmentation and anterior expansion at the onset of neurulation. In addition to linear strain, symmetric patterns of rotation/curl are first detected in the animal hemispheres at mid-epiboly and then the vegetal hemispheres by the end of gastrulation. In embryos treated with C59, a Wnt inhibitor that inhibits head and tail extension, the axial extension and vegetal curl are absent. By analysing the temporal sequence of large-scale movements, deformations across the embryo can be attributed to a combination of epiboly and dorsal convergence-extension.
Figure sample
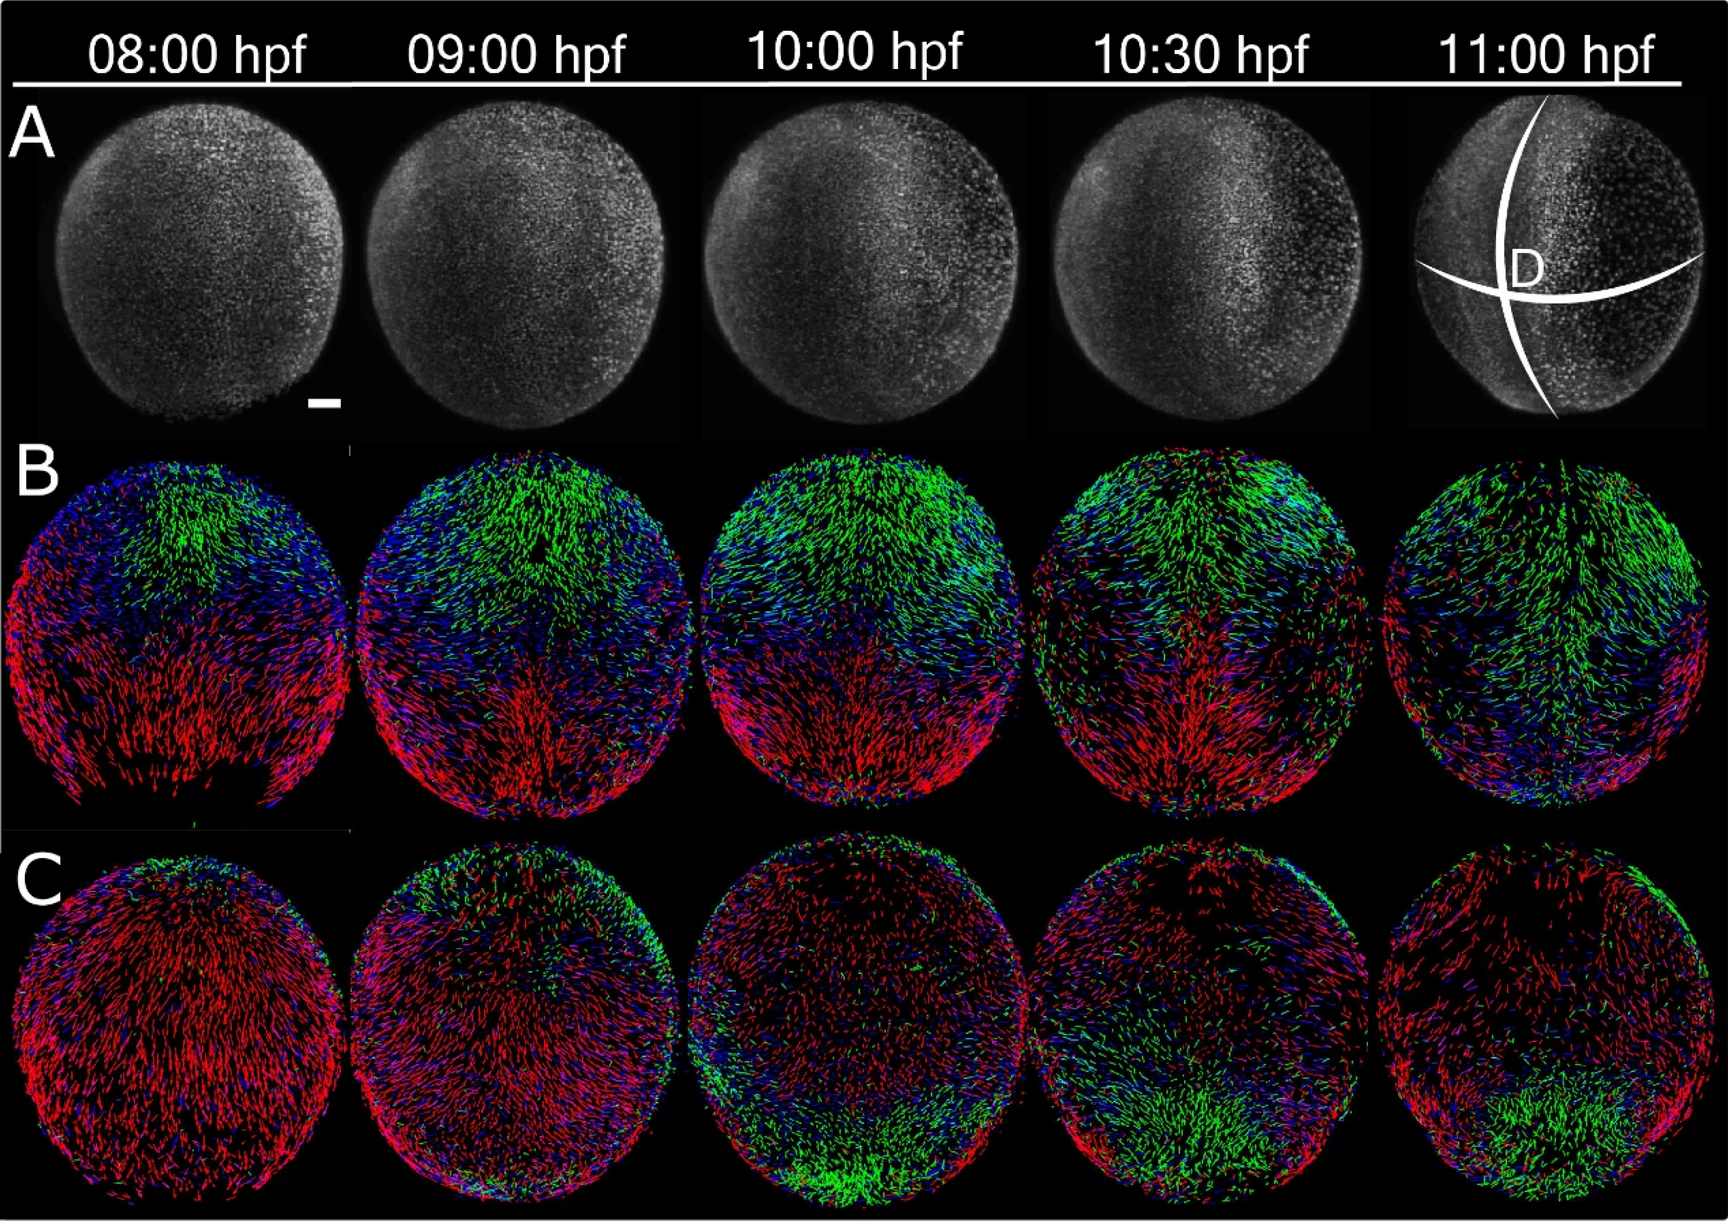
Velocity field maps of zebrafish from mid-gastrula to early segmentation stages. (A) Dorsal views of GFP-histone H2B-tagged embryos at 8 hpf (80% epiboly), 9 hpf (90% epiboly), 10 hpf (100% epiboly), 10.5 hpf (1 somite), 11 hpf (1–3 somite stages) respectively. Velocity field maps of the dorsal (B) and ventral (C) views of the velocity field maps. The length of the velocity vector represents the magnitude of the domain velocity over a 2-min interval. The color of the vectors represents the directions: Green towards animal pole, Red towards Vegetal pole, and Blue color represents the medio-lateral convergence or divergence. For all views, the embryo is oriented with anterior (A) and posterior (P) to the top and bottom respectively. Scale bar—10 µm.