
Citation
S. Curran, C. Strandkvist, J. Bathmann, M. de Gennes, A. Kabla, G. Salbreux and B. Baum
Developmental Cell 43(4):480-492 (2017)
Abstract
Abstract
Under conditions of homeostasis, dynamic changes in the length of individual adherens junctions (AJs) provide epithelia with the fluidity required to maintain tissue integrity in the face of intrinsic and extrinsic forces. While the contribution of AJ remodeling to developmental morphogenesis has been intensively studied, less is known about AJ dynamics in other circumstances. Here, we study AJ dynamics in an epithelium that undergoes a gradual increase in packing order, without concomitant large-scale changes in tissue size or shape. We find that neighbor exchange events are driven by stochastic fluctuations in junction length, regulated in part by junctional actomyosin. In this context, the developmental increase of isotropic junctional actomyosin reduces the rate of neighbor exchange, contributing to tissue order. We propose a model in which the local variance in tension between junctions determines whether actomyosin-based forces will inhibit or drive the topological transitions that either refine or deform a tissue.
Figure sample
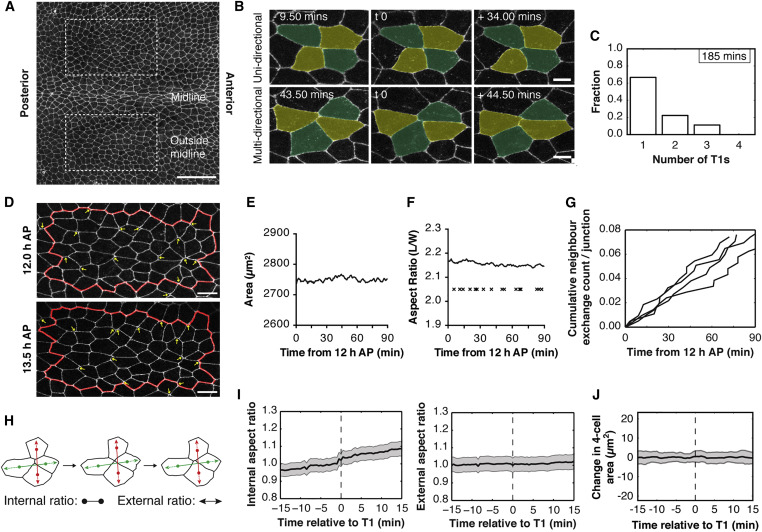
Neighbor Exchange Events Do Not Contribute to Tissue Morphogenesis.
(A) Apical surface projection of a live Drosophila notum labeled with DE-cadherin-GFP at 12 hr APF. Image regions are indicated by dashed boxes. Scale bar, 50 μm.
(B) Neighbor exchange events are reversible. Top: Example of a uni-directional neighbor exchange event. Bottom: A multi-directional neighbor exchange event. Scale bar, 5 μm.
(C) Bar graph showing the fraction of multi-directional transition events for a representative fly. See Figure S1A for further n.
(D) Representative region of the notum, outside the midline, at 12.0 and 13.5 hr APF. Yellow arrows at 12 hr label junctions that are lost, and at 13.5 hr label junctions that have been gained through neighbor exchange events. Scale bar, 10 μm.
(E and F) Line plots showing the area (E) and aspect ratio (F) of the virtual clone of cells shown within the red line in (D), measured over 90 min at 30 s intervals. Crosses in (F) mark the temporal position of neighbor exchange events during this time (each cross represents the time at which a four-way vertex is formed). (G) Cumulative frequency, for four individuals, of neighbor events over a 90-min period, normalized to the number of junctions within the frame at 12 hr APF.
(H) Diagram of a neighbor exchange event at the center of a four-cell cluster. The center of area of each cell (CoA, marked with a dot) is calculated. The internal aspect ratio is the distance between the CoAs of the cells losing a junction (red) divided by the distance between the CoAs of cells gaining a junction (green). For the external aspect ratio, the axis between the CoAs is extended out and the distance between the perimeter intersections is calculated. (I) Mean aspect ratio (left, internal; right, external) for the four-cell cluster neighbor exchange event. Error bars represent SEM.
(J) Mean change in cell area for the four-cell cluster involved in neighbor exchange. The cell area was measured from 15 min before to 15 min after the transition and, for each four-cell cluster, the mean was subtracted from the time series. Mean area for four-cell cluster = 222.3 μm2. Error bars represent SD n for (I) and (J), 33 exchange events from four flies.