
Citation
A. Ravasio, I. Cheddadi, T. Chen, T. Pereira, H.T. Ong, C. Bertocchi, A. Brugues, A. Jacinto, A.J. Kabla, Y. Toyama, X. Trepat, N. Gov, L. Almeida, B. Ladoux
Nature Communication 6:7683 (2015)
Abstract
Abstract
Closure of wounds and gaps in tissues is fundamental for the correct development and physiology of multicellular organisms and, when misregulated, may lead to inflammation and tumorigenesis. To re-establish tissue integrity, epithelial cells exhibit coordinated motion into the void by active crawling on the substrate and by constricting a supracellular actomyosin cable. Coexistence of these two mechanisms strongly depends on the environment. However, the nature of their coupling remains elusive because of the complexity of the overall process. Here we demonstrate that epithelial gap geometry in both in vitro and in vivo regulates these collective mechanisms. In addition, the mechanical coupling between actomyosin cable contraction and cell crawling acts as a large-scale regulator to control the dynamics of gap closure. Finally, our computational modelling clarifies the respective roles of the two mechanisms during this process, providing a robust and universal mechanism to explain how epithelial tissues restore their integrity.
Figure sample
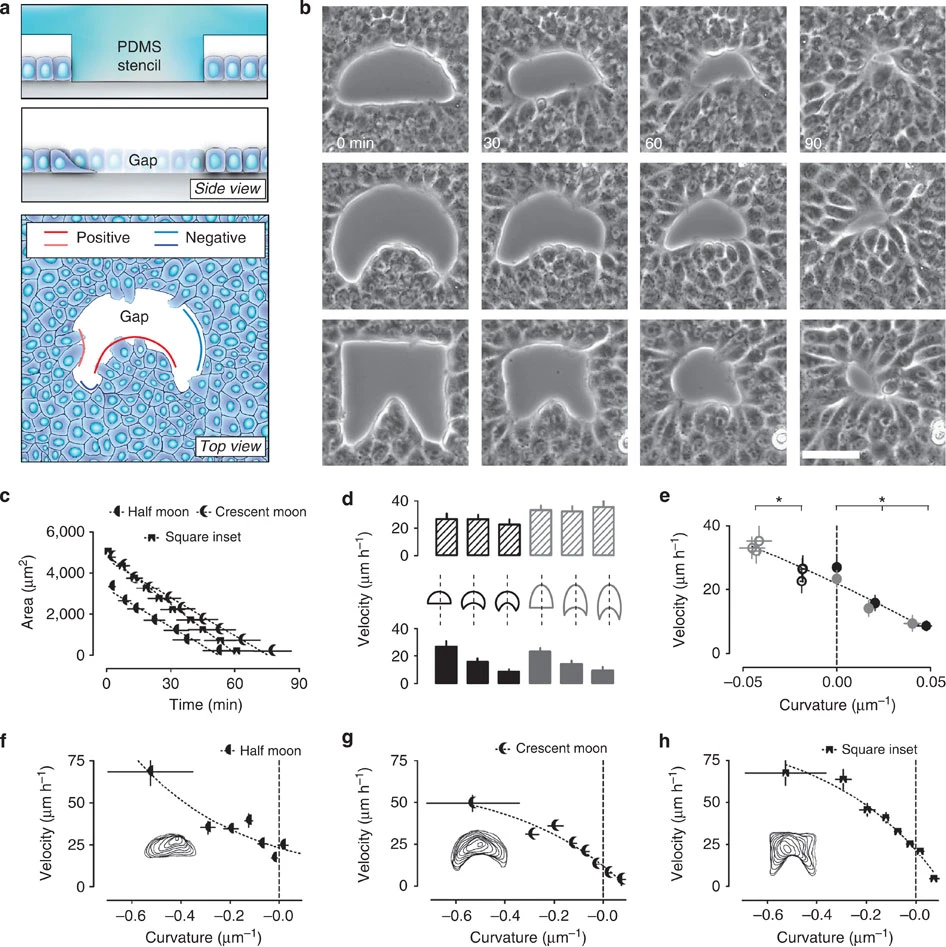
(a) Cartoons showing in vitro generation of damage-free gaps in an epithelial wound model experiment. Top, a PDMS stencil serves as a block to create damage-free gaps with well-defined geometries. Middle, after removal of the stencil, epithelial cells move into the voided area. Bottom, top view of a gap after removal of the stencil. In this paper, the epithelium protruding into the gap (where the tissue is locally convex) is defined as having a positive curvature. Conversely, concave regions are defined as being negatively curved. (b) Example time lapses of gap closure. Voids of varying geometries were created in confluent and mature epithelia. Scale bar, 50 μm. (c) Decay in the area of differently shaped gaps over time (n=15–18). (d) The cartoon shows the six different moon-like gaps used to test dependence of velocity on local curvature. The edge movement velocity is measured at the intersection between dashed line and the north (negative curvature) or south pole (flat or positive) of the gap. Bar plots display the edge movement velocity measured at the intersection between the dashed line and the north (negative curvature=textured bars) or south pole (flat or positive curvature=full bars) of the gap. (e) Plot of velocity as a function of curvature from the experiments shown in d. Empty and full circles correspond to top and bottom bar plots in d, respectively. The dashed line indicates linear fitting of data as a visual guide. Stars indicate a statistically significant difference of velocity (P<0.05; n=12–23). (f–h) Velocity plots of randomly chosen points at the edge of gaps as in b. Logarithmic fitting (best fit; R2=0.89–0.98) of experimental data are shown by dashed line as a visual guide (n=15–18). Insets, overlay of outlines at different time points from representative experiments. Error bars indicate s.e.m. Samples are considered statistically different for P<0.05 in unpaired Student’s t-test and are indicated by the star.