Citation
T.P.J. Wyatt, J. Fouchard, A. Lisica, N. Khalilgharibi, B. Baum, P. Recho, A.J. Kabla, G.T. Charras
Nature Materials 19(1):109-117 (2020)
Abstract
Abstract
Under conditions of homeostasis, dynamic changes in the length of individual adherens junctions (AJs) provide epithelia with the fluidity required to maintain tissue integrity in the face of intrinsic and extrinsic forces. While the contribution of AJ remodeling to developmental morphogenesis has been intensively studied, less is known about AJ dynamics in other circumstances. Here, we study AJ dynamics in an epithelium that undergoes a gradual increase in packing order, without concomitant large-scale changes in tissue size or shape. We find that neighbor exchange events are driven by stochastic fluctuations in junction length, regulated in part by junctional actomyosin. In this context, the developmental increase of isotropic junctional actomyosin reduces the rate of neighbor exchange, contributing to tissue order. We propose a model in which the local variance in tension between junctions determines whether actomyosin-based forces will inhibit or drive the topological transitions that either refine or deform a tissue.
Figure sample
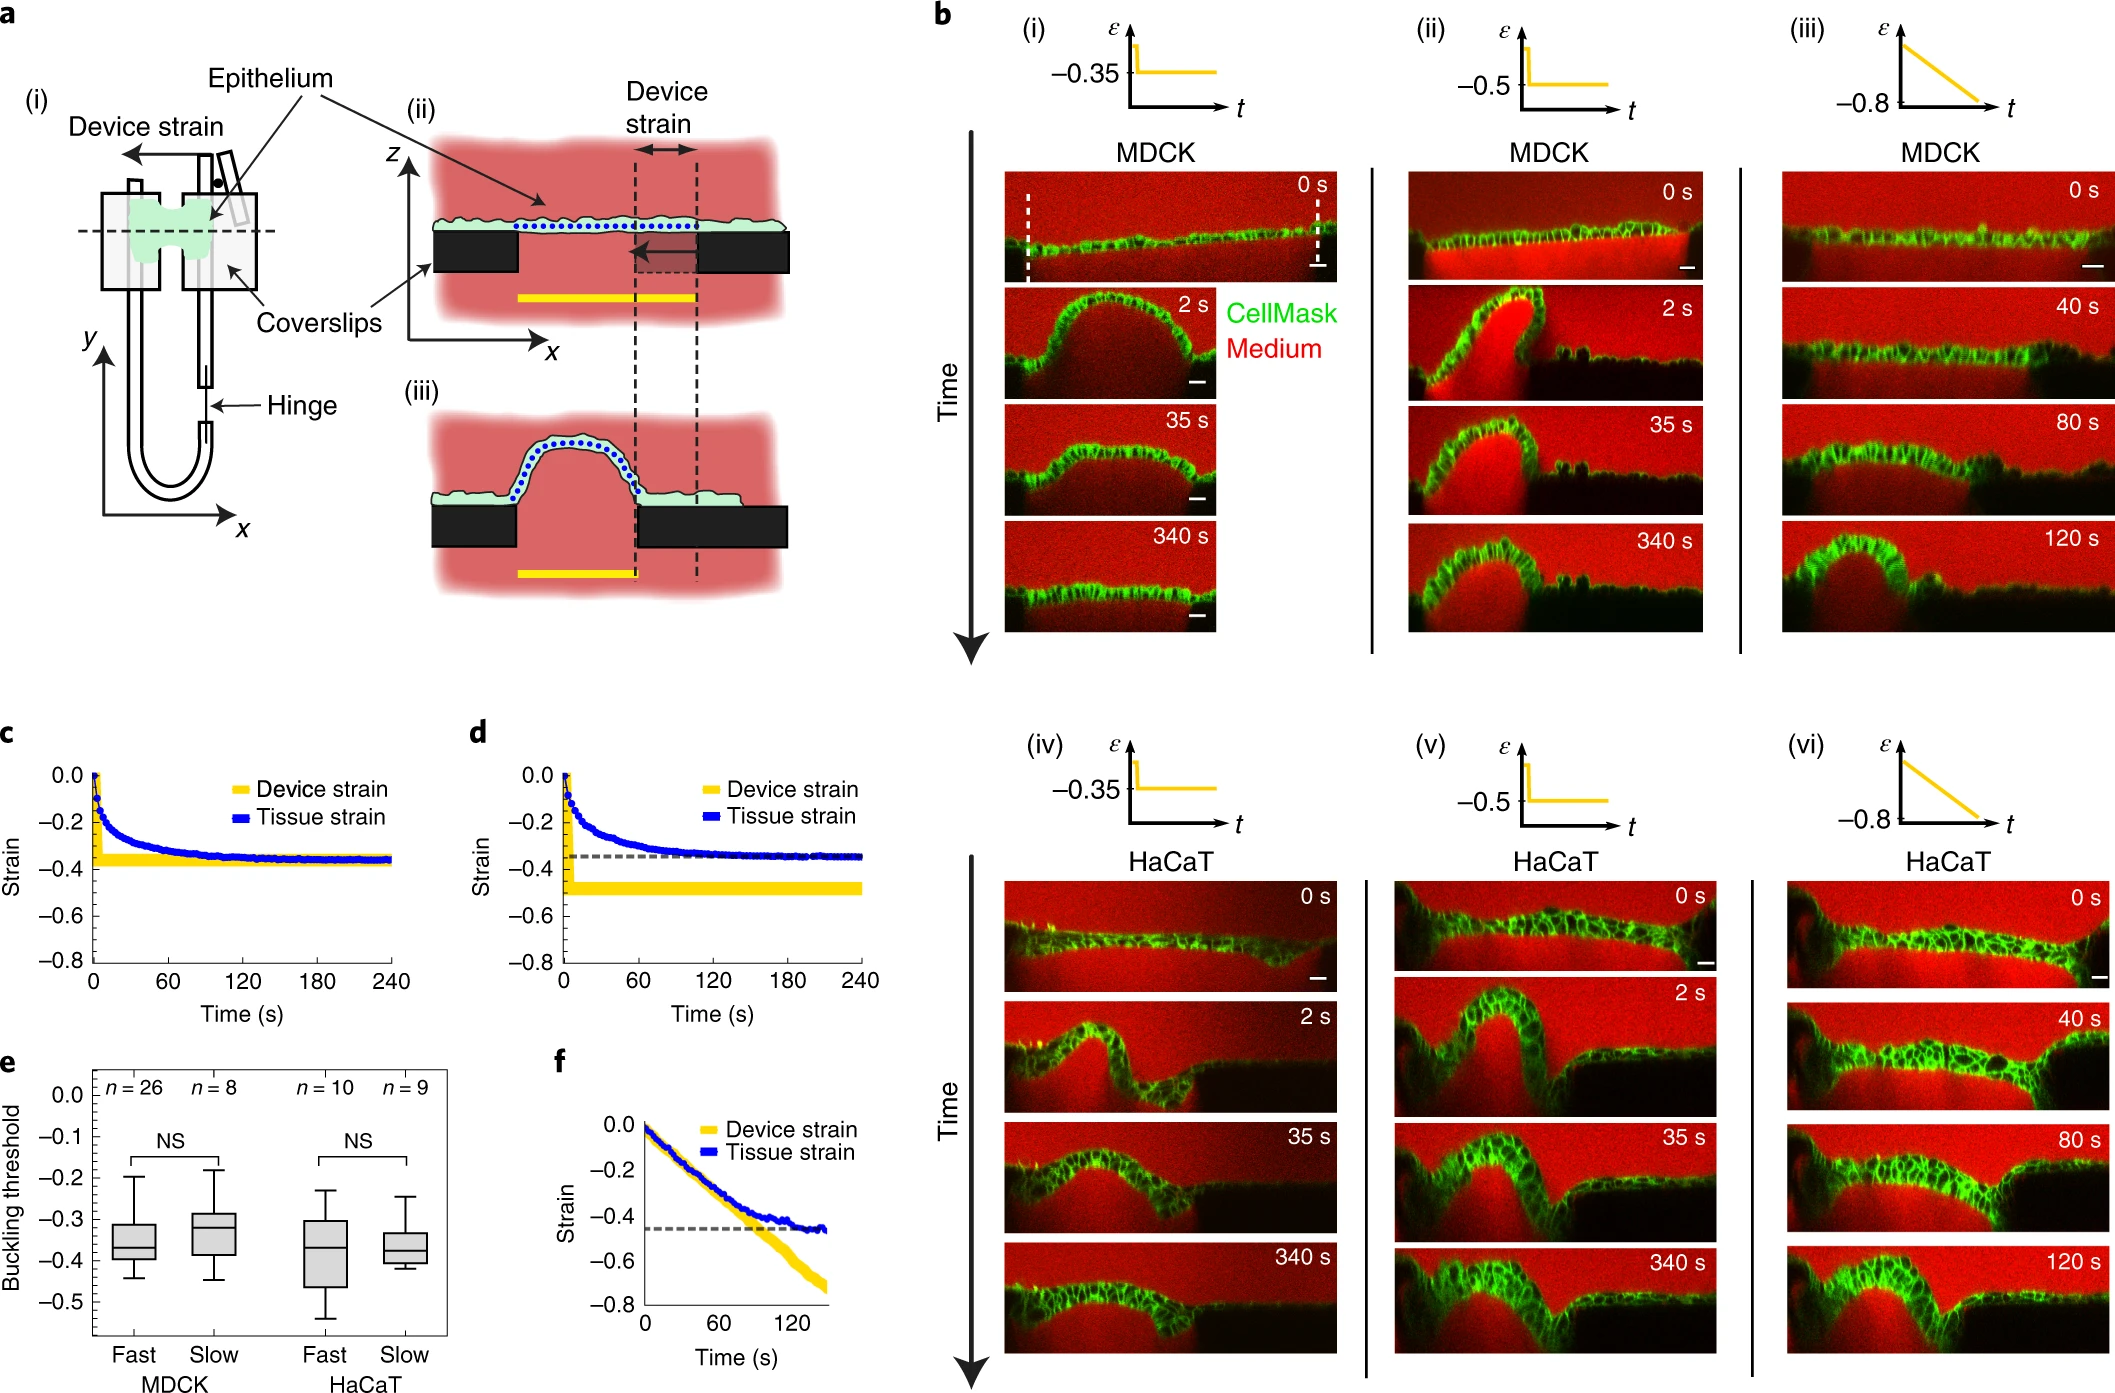
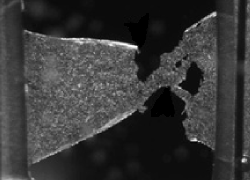
a, Schematic diagram showing the method for application of compressive strain to suspended epithelia. (i), Top view of the mechanical manipulation device. Uniaxial strain is applied to the tissue (green) by displacing the flexible arm. (ii),(iii), Profile views of the setup along the dashed line in (i): an epithelium (green) is suspended between two coverslips (black) (ii) and the right-hand coverslip is displaced, deforming the tissue (iii). The yellow lines denote the distance between the coverslips from which the applied ‘device strain’ is calculated. The blue dotted lines denote the tissue contour length. b, Time series of profiles of epithelia before and during application of various compressive strains ε, applied at different rates. Strain was applied either as a step at high strain rate (500% s−1, (i),(ii) and (iv),(v)) or as a ramp at low strain rate (0.5 % s−1, (iii),(vi)): step of intermediate amplitude (−35%) (i); step of large amplitude (−50%) (ii) and strain ramp (−80%) (iii), applied to MDCK monolayers. (iv)–(vi), As in (i)–(iii) but for multi-layered HaCaT epithelia. Cell membranes are marked with CellMask (green), the medium is visualized using dextran Alexa-647 (red) making coverslips appear dark by dye exclusion. Scale bars, 20 μm. The number n of biologically independent repeats of the representative images and the corresponding data in c,d,f is n = 17, 26, 8, 7, 10, 9, from (i)–(vi). c,d, Temporal evolution of the tissue strain (blue) of an MDCK monolayer after a step of −35% device strain (yellow) (c) and −50% device strain (d). e, Comparison of the buckling threshold εb in MDCK and HaCaT epithelia measured following a fast step or a slow ramp of compressive strain. NS, not significant, P = 0.45, 0.65 for MDCK and HaCaT, respectively; Mann–Whitney U-test. The distributions’ medians, first and third quartiles and ranges are represented by the central bars, bounding boxes and whiskers, respectively. The number of biologically independent experiments is given above each box plot. f, Temporal evolution of the tissue strain (blue) during a ramp of device strain (yellow). The dashed lines in d,f mark the maximum tissue strain, termed the buckling threshold εb.